Living in an Apple, Amazon, Microsoft, Google and Facebook World
2020 has been an interesting year to say the least but understanding the stock market on a retroactive perspective is easy – The bigger more expensive companies are outperforming the smaller less expensive companies.
Let’s take a look at the S&P 500 – Currently made up of 505 companies with a combined market cap of roughly $29 trillion dollars. As of Monday July 6th, around noon the index is down .07% for the year, keep in mind this isn’t from the all-time highs of February but as of January 1st 2020. Considering the market was down 34% at the lows in March, this is a welcome position to be in.
When we drill down into the data and break the index into individual components and look at MEDIAN results, we find something interesting. Of the 505 companies the top 10 (Market Cap of 848.5 billion) are not only the most expensive with a Price to Earnings ratio of 31.4 but they encompass almost all of the returns in the SP500 this year. The top 10 companies have year to date returns of 9.6% as seen in the chart below. The next 50 (Market Cap of 198.7 billion) and a price to earnings ratio of 28.7 have YTD returns of 2.4%. When you lump together the next 445 companies, they have a negative return YTD.
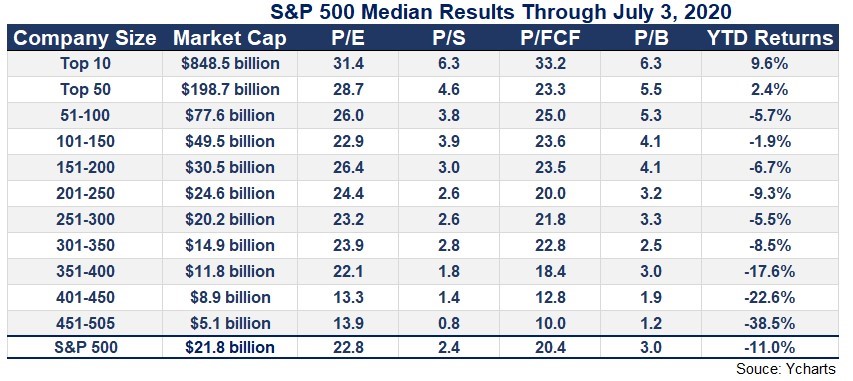
You can see an obvious pattern based on the above chart. The biggest companies by market cap are the most expensive by traditional valuation metrics and have the best returns this year. On the flipside the smallest companies by market cap are the least expensive (lower P/E ratio) have the worst returns this year.
This is not always the case and the mapping is rarely this clear by size but this years performers are crystal clear. Considering the median stock in the index is down 11% on the year, the fact that the market is more or less flat can be explained exclusively by the biggest companies holding the highest weights in the S&P 500. The top 50, really the top 10 stocks have more than made up for the larger median losses in the rest of the market.
What does that mean for you? There are really two ways to view the data:
- The S&P 500 is so top-heavy that if these stocks weaken, look out below!
- This is the nature of a market-cap weighted index where the winners carry the day
It was recently disclosed that Berkshire Hathaway’s $90 billion Apple stake is now 43% of Berkshire’s entire stock portfolio. I would suspect that Mr. Buffet would not like the sheer weight of his Apple position, but it has grown so large to unwind a position this large would almost certainly result in a dramatic drop in the price of Apple stock.
During a CNBC interview in February Mr. Buffet said “I don’t think of Apple as a stock,” “I think of it as our third business”.
It is not just Buffet though here is a chart showing the SP500 holdings
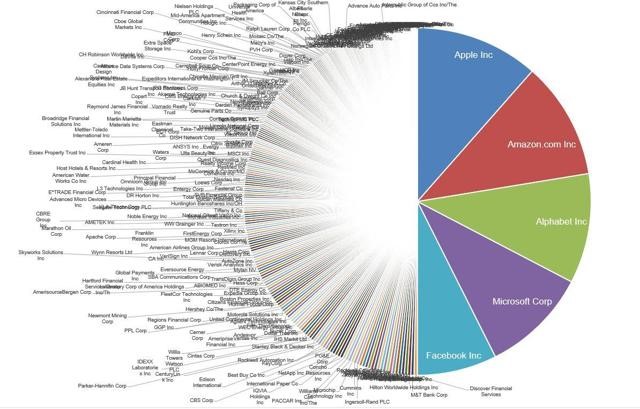
As you can see 5 companies are worth (combined) more than 56% of the companies that make up the S&P 500. The thing that I find a bit unsettling is the lack of diversification amongst the top 5 stocks, they are all tech stocks.
The fact that so much of the S&P 500’s return is in the hands of a very few stocks is not only abnormal but also could be dangerous. The question I ask is this an opportunity to buy into the world’s largest companies or a threat to own a handful of stocks that have so much fire power in their hands? Going forward it will be important to position ourselves for the eventual rebalancing act from many of the larger fund companies. When they rebalance those assets, they are likely to go from the top 5 tech stocks to other areas of opportunity based on a valuation perspective. Based on your current risk level and the risk associated with the higher valuations and concentration in the top 5 companies I am looking for opportunity of where the money may go next and these are some of the purchases we are making.
Be on the lookout for next month’s post about – What the presidential election may mean for the economy and inturn what that may mean for the market.
Be safe and be well!
|
Philip lockwood | Founder + Managing Partner |
|
Address: 3100 Ingersoll Ave. Des Moines, IA 50312 Phone: 515-274-8006 |
|
Email: Plockwood@parklandrep.com Website: Lockwood Financial Strategies Securities offered through Parkland Securities, LLC, member FINRA (FINRA.org) and SIPC (SIPC.org). Investment Advisory services offered through SPC, a Registered Investment Advisor. Lockwood Financial Strategies, LLC is independent of Parkland Securities, LLC and SPC Securities offered through Parkland Securities, LLC, member FINRA/SIPC.
|