
90’s Nostalgia
Who is excited for Beanie Babies, Forrest Gump, and the mullet? For most investors, 1994 wasn’t a particularly notable year. There was no presidential election, no major geopolitical conflicts, no stock market crash, and no summer Olympics. The year was 1994, and from a financial perspective I see plenty of parallels between now and then.
There is no doubt 2022 will be the year of the Federal Reserve
The Federal Reserve is currently gearing up for the most aggressive rate-hike cycle in the last 30 years. Inflation is high, the Fed is likely behind the curve and recent comments from several Federal Reserve Officials suggest they are taking the rising inflation very seriously. As I write this piece, I am expecting a 50-basis point rate hike in May, and likely multiple 50-basis point rate hikes throughout the remainder of the year. I would guess we will have a Federal Fund rate of around 3% by December 2022. If the Fed carries through, this will be the most aggressive rise in the fed funds rate since 1994, when the fed funds rate rose from 3% to 5.5% in one year.
What happened to the market in 1994?
The economy did a good job withstanding the doubling of the Fed Funds rate in 1994. The S&P 500 returned an unmemorable 1.33% in 1994. The bond market did suffer a collapse that year. When the Fed implemented its’ tightening policy by raising rates, the bond market suffered a sharp and sudden sell off. When the year wrapped up, Bloomberg Aggregate bond index returned (-2.92%) on the year. https://www.thebalance.com/stocks-and-bonds-calendar-year-performance-417028
Bonds tend to fall when there is a better fixed-income alternative. In 1994 the one-year U.S. Treasury bills were paying around 7.2% risk-free. This led to many Americans putting their money in CD’s, Treasury Bills and Money Markets, instead of bonds.
This info graph does a nice job of putting returns in context for the year 1994.

What is happening in our current market environment?
Today’s environment is much more complex than things were in 1994. We do have geopolitical conflict in Ukraine, which is compounding our current inflationary environment, along with the still recovering supply chain issues as a result of the Covid-19 pandemic. This is all forcing the Feds’ hand in raising rates, sooner than later to help control inflation. While current rates have not increased to the levels seen in 1994, we have had a significant decrease in the bond market this year. As I write this article (May 5th, 2022) the Vanguard Total Bond Market ETF is down 9.8% year to date. The S&P 500 is down 12.75% as a result of many of the above issues and the uncertainty of avoiding a future recession. The Fed must walk a delicate line between raising rates too fast and having a dramatic slowdown in growth. Whether they can achieve this feat without sending us into a recession is yet to be seen, but something I am always monitoring. The definition of a recession is important, a recession is defined as a period of temporary economic decline during which trade and industrial activity are reduced, generally identified by a fall in GDP in two successive quarters.
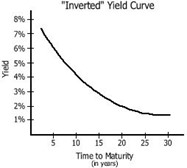
The raising of interest rates normally leads to slower growth as people are borrowing less money. Slower growth normally leads to slower inflation as people are spending less and supply is increased. If growth slows at too quickly of a rate, we see a decline in GDP, leading to a recession. Now that we have the definition down and a bit more understanding as to what can lead to a recession, it is important to identify other leading recessionary indicators. The foremost leading indicator is likely the inversion of the yield curve.
How does an inverted yield curve happen? When the Federal Reserve hikes the short-term federal funds interest rate, the short end of the curve begins to rise as the yield on short-term T-bills reflects tighter monetary policy. The long end of the yield curve does not rise since changes to the federal funds rate do not have a direct impact on long-term yields. Long-term yields are influenced by inflation expectations, risk premium, and investor preferences.
As short-term rates increase, it can give investors an alternative to bonds/stocks with a more attractive short-term rate of return.
The yield curve inverted for just two days in early April. Such a brief inversion is unlikely a signal of an impending recession.
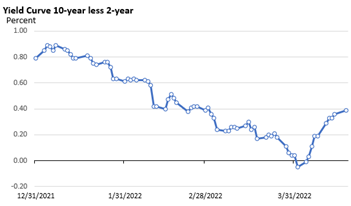 Source: St. Louis Federal Reserve 4/18/2022
If the yield curve were to invert, it does not tend to lead to a quick recession.

How do stocks perform after an inversion?
Historically they have done well.
|
Table 2: Market Performance Following 10-Year/2-Year Inversion |
||||
|
S&P 500 Index at inversion |
S&P 500 Index peak |
Date of Peak |
Advance from inversion to peak |
Time from inversion to peak |
|
2,869.16 |
3,386.15 |
Feb 19, 2021 |
18.0% |
6 months |
|
1,256.54 |
1,565.15 |
Oct 9, 2007 |
24.6% |
22 months |
|
1,094.02 |
1,527.46 |
Mar 24, 2000 |
39.6% |
22 months |
|
276.31 |
368.95 |
Jul 16, 1990 |
33.5% |
19 months |
|
125.54 |
140.52 |
Nov 28, 1980 |
11.9% |
3 months |
|
104.73 |
118.44 |
Feb 13, 1980 |
13.1% |
18 months |
Source: St. Louis Federal Reserve, NBER –Past performance is no guarantee of future performance
Why does any of this matter, and how can it influence retired fixed-income investors? As scary as this sounds, a flattening alone does not mean that the United States is doomed to slip into another recession; but if it keeps moving in this direction, eventually long-term interest rates will fall below short-term rates. When this happens, it creates an inverted yield curve, this inversion is seen as a powerful signal of a recession. An inverted yield curve has correctly signaled all nine recessions since 1955 and had only one false positive, in the mid-1960’s, when an inversion was followed by an economic slowdown, but not an official recession. Something to remember is an inverted yield curve doesn’t predict precisely when recession will begin. In the past, the recession has come in as little as six months, or as long as two years after the inversion.
This all sounds great, but how does this affect me? Let’s take a quick look at the banking sector. Banks borrow money at short-term rates and lend it at long-term rates. When short-term rates are higher than long-term rates it means lending money becomes a losing proposition. When lending money slows or stops, it can have a great impact on growth or expansion, as businesses looking to grow can only spend their cash on hand and can’t leverage a bank’s assets. Borrowed money is the lifeblood of economic activity, and this can slam the brakes on economic growth.
There is no doubt that high inflation and expected rate hikes have been a stiff headwind for stocks. There have been some recent indicators that may suggest that inflation is beginning to peak as we saw a more muted gain in core CPI. If inflation begins to peak, then the Fed can slow down the raising of the short term fed funds rate, and this could avoid a yield curve inversion. We are just wrapping up with quarterly conference calls and reports and overall, the economy is expanding, and profit growth has been a tailwind that has cushioned the downside of equities a bit. I believe it is going to be a volatile remainder of the year and a year where focusing on individual stocks and utilizing ETFs with downside buffers will be imperative for your portfolios moving forward. It is a year where you may see more trading activity than normal in your portfolios, as I rebalance and make changes to accommodate the current economic landscape.
![]()
|
PHILIP LOCKWOOD | FOUNDER + MANAGING PARTNER |
|
ADDRESS: 3100 INGERSOLL AVE. DES MOINES, IA 50312 PHONE: 515-274-8006 |
|
EMAIL: PLOCKWOOD@PARKLANDREP.COM WEBSITE: LOCKWOOD FINANCIAL STRATEGIES
Securities offered through Parkland Securities, LLC, member FINRA (FINRA.org) and SIPC (SIPC.org). Investment Advisory services offered through SPC, a Registered Investment Advisor. Lockwood Financial Strategies, LLC is independent of Parkland Securities, LLC and SPC
Securities offered through Parkland Securities, LLC, member FINRA/SIPC. |