LFS Market Commentary
It has been a brutal week for the markets, but this is why we invest for the long term.
If you didn’t get a chance to read my January newsletter, here is a copy. It has come to play out much like we anticipated.
https://www.lockwoodfinancialstrategies.com/2022-fed-fight-rate-hike-and-inflations-plight/
Why do we stay invested then? We stay invested because no one has a crystal ball, and we are invested for the long term. Market timing has proven to be a bad strategy. While I know a rollercoaster ride like this can be uncomfortable, sometimes it takes this level of unrest to get our appropriate risk levels back in line after a large bull market run.
Now is the best time to call and schedule a meeting if you are feeling uneasy with your portfolio. I am available to look at things, discuss investment philosophy and realign your risk tolerance if appropriate. The S&P 500 recently entered a bear market, down 20%+, this bear market is driven by recession fears, incredibly high inflation and the Federal Reserve raising interest rates. Let’s break each one of these items down to get a better understanding of our current situation.
Recession Fears – 5 Facts you should know about a recession:
- What is the definition of a recession? Two quarters of consecutive GDP contraction is the standard shorthand for a recession, as measured by the National Bureau of Economic Research.
- What is a GDP contraction? GDP is the primary measure used to assess the health of the economy and define the phase of the business cycle, the ancillary effects of a contraction are what the public feels most. Decreased productivity, increase in unemployment, lower wages, less money spent in the economy, which can further exacerbate the business cycle contraction.
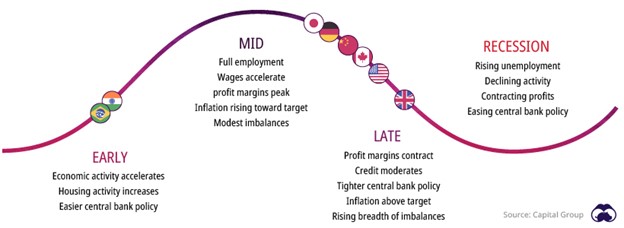
- Now that we have defined a recession – how long do they normally last? The average length of a recession, going all the way back to 1857, is less than 17.5 months. Recessions have actually been shorter and less severe since the days of the Buchanan administration (never thought I would compare much to the Buchanan administration 😊). The long-term average includes the 1873 recession – that lasted 65 months. It also includes the Great Depression, which lasted 43 months. If we look at the period since World War II, recessions have become less harsh, lasting an average of 11.1 months.
- How often do Recessions Happen? Since World War II, we’ve gone an average of 58.4 months between recessions, or nearly five years.
- What could cause this recession? – The Federal Reserve vs. Inflation – The Federal Reserve had a dual mandate 1) Keep the economy strong 2) Keep inflation low. As we know, inflation has currently spiked for several reasons. Here are a few; production issues globally/supply constraints (Covid-19), Global Demand strength/people want to spend money (Covid-19), abnormally high savings rates (Covid-19), government injections of cash into the economy/stimulus (Covid-19), High Gas prices (several reasons), etc. The main cure for high inflation is higher interest rates, which tends to slow borrowing/growth and slows the economy. The slowing of the economy slows demand and lets supply catch back up, which in-turn lowers inflation. In 1981, the Fed Hiked interest rates so high that three-month T-bills yielded more than 15%. Those rates put the brakes on the economy and ended inflation – at the price of a short, but sharp recession.
Once a recession ends, we enter an expansion period of growth. The good news at the end of historical recessionary periods is that expansions tend to last much longer than a recession, 67 months compared to the average recession of 11 months.
https://www.visualcapitalist.com/recessions-everything-you-need-to-know/
When do stocks historically begin to rise again? I think to answer this question we must understand that by the time the NBER announces the start of a recession, it is normally over halfway finished. Historically, it has taken the NBER at least 6 months to determine if a recession has started; occasionally, it takes longer. The average post-WWII recession lasts 11.1 months. Often, by the time the bureau has figured out the start of the recession, it’s close to the end. The market tends to anticipate the beginning of a recovery long before the NBER does, and stocks begin to rise around the time of the actual economic turnaround. Let’s take a look at a few of the more recent recessions for that answer.
The Great Recession – Officially announced on December 1, 2008 (a full year after it had started). The recession ended in June 2009; the bear market ended three months earlier, on March 6, 2009. The ensuing bull market lasted more than a decade. In the most recent case, the NBER called the end of the Pandemic Recession on July 19th, 2021, or 15 months after it ended. Meanwhile, the S&P 500 gained 50% from April 30, 2020, to July 14, 2021.
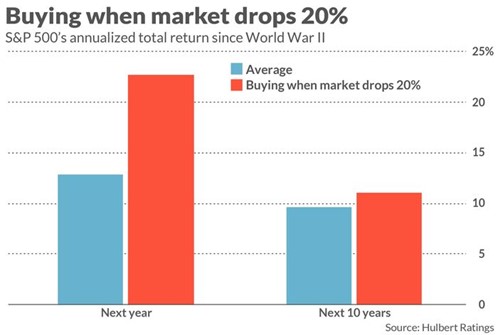
How would you have done if, in every bear market since World War II, you bought stocks on the day the S&P 500 closes below the 20% loss threshold (entered a bear market). Sometimes the upturn happened shortly after the 20% threshold was reached, and other times the market continued to fall before it eventually turned up. With time on your side you would have done very well. Over the 12 months following your buys, your average total return would have been 22.7%.
This illustrates why we stay invested and why it is nearly impossible to repeatedly time the market. One of my favorite quotes on timing the market is from famed investor Peter Lynch who said, “Far more money has been lost by investors trying to anticipate corrections, than lost in the corrections themselves.” Market correction can often present an opportunity. Warren Buffett is famous for saying “A market downturn doesn’t bother us. It is an opportunity to increase our ownership of great companies, with great management, at good prices.”.
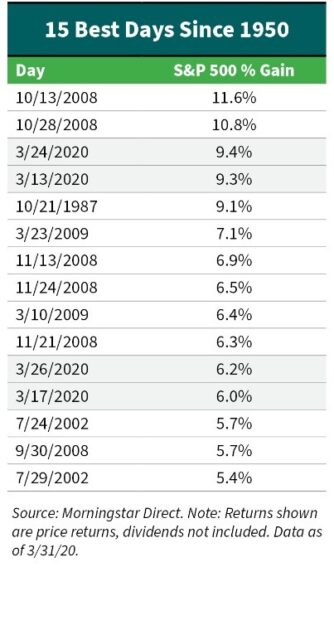
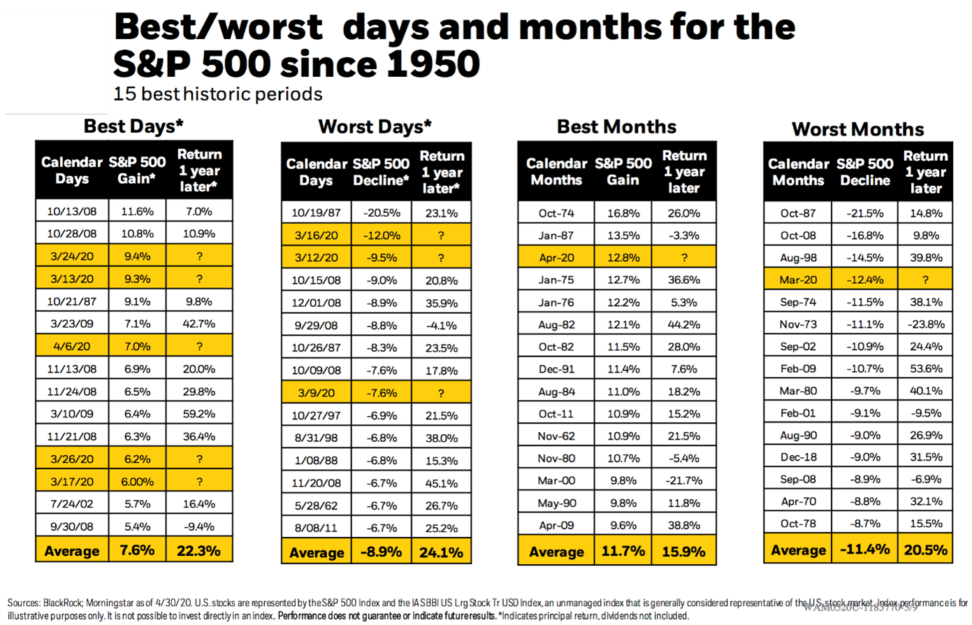
To correctly time the market you must not only get the decision to get out correctly, but you must also time the decision to get back in. I have included a table below that shows the best 15 days for the S&P 500.![]()
Surprisingly, ALL of them occurred within bear markets, not bull markets, like you might expect. The biggest upturns in the market can happen during times when it’s hardest to remain invested. Recency bias would suggest that someone’s most recent experience has the greatest influence on their decisions. Investors tend to sell after a meaningful market selloff, and buy after a market rally.
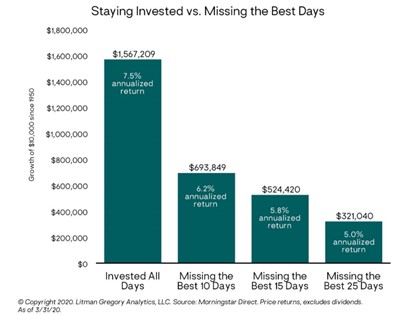
Missing just the 10 best days (out of more than 17,500 trading days since 1950) has a huge long-term effect on a portfolio. For example, if you invested $10,000 in the S&P 500 in 1950, it would have gained 7.5% annualized, and finished with a portfolio value of more than $1.5 million (as of 3/31/2020). If they had remained full invested (not including dividends), the final portfolio value for the same investor who missed the 10 best days is much, much lower – just shy of $700,000.
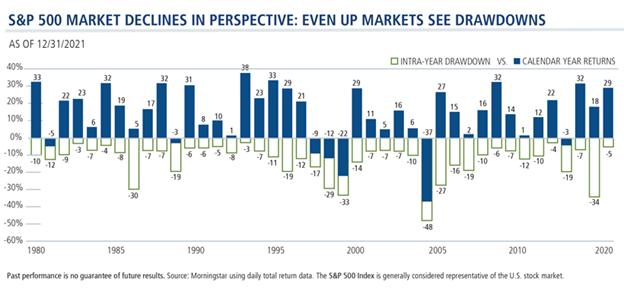
Notice the largest annual returns normally happen after the worst days/months.
One of the most important benefits of working with Lockwood Financial Strategies is that I can help you manage your financial situation in a holistic way, which will enable you to stay true to your long-term investment strategy with guidelines, discipline, and risk management. The best times to have conversations are when you are uncomfortable. That is when we can really dial in your risk tolerance, and prepare a plan for your long-term retirement picture, not just the next 12-24 months.
|
Philip lockwood | Founder + Managing Partner
|
|
Address: 3100 Ingersoll Ave. Des Moines, IA 50312
Phone: 515-274-8006
|
|
Email: Plockwood@parklandrep.com
Website: Lockwood Financial Strategies
Securities offered through Parkland Securities, LLC, member FINRA (FINRA.org) and SIPC (SIPC.org). Investment Advisory services offered through SPC, a Registered Investment Advisor. Lockwood Financial Strategies, LLC is independent of Parkland Securities, LLC and SPC
Securities offered through Parkland Securities, LLC, member FINRA/SIPC.
|

